ProjectsData Analysis
Olist Sales & Delivery Analytics Dashboard
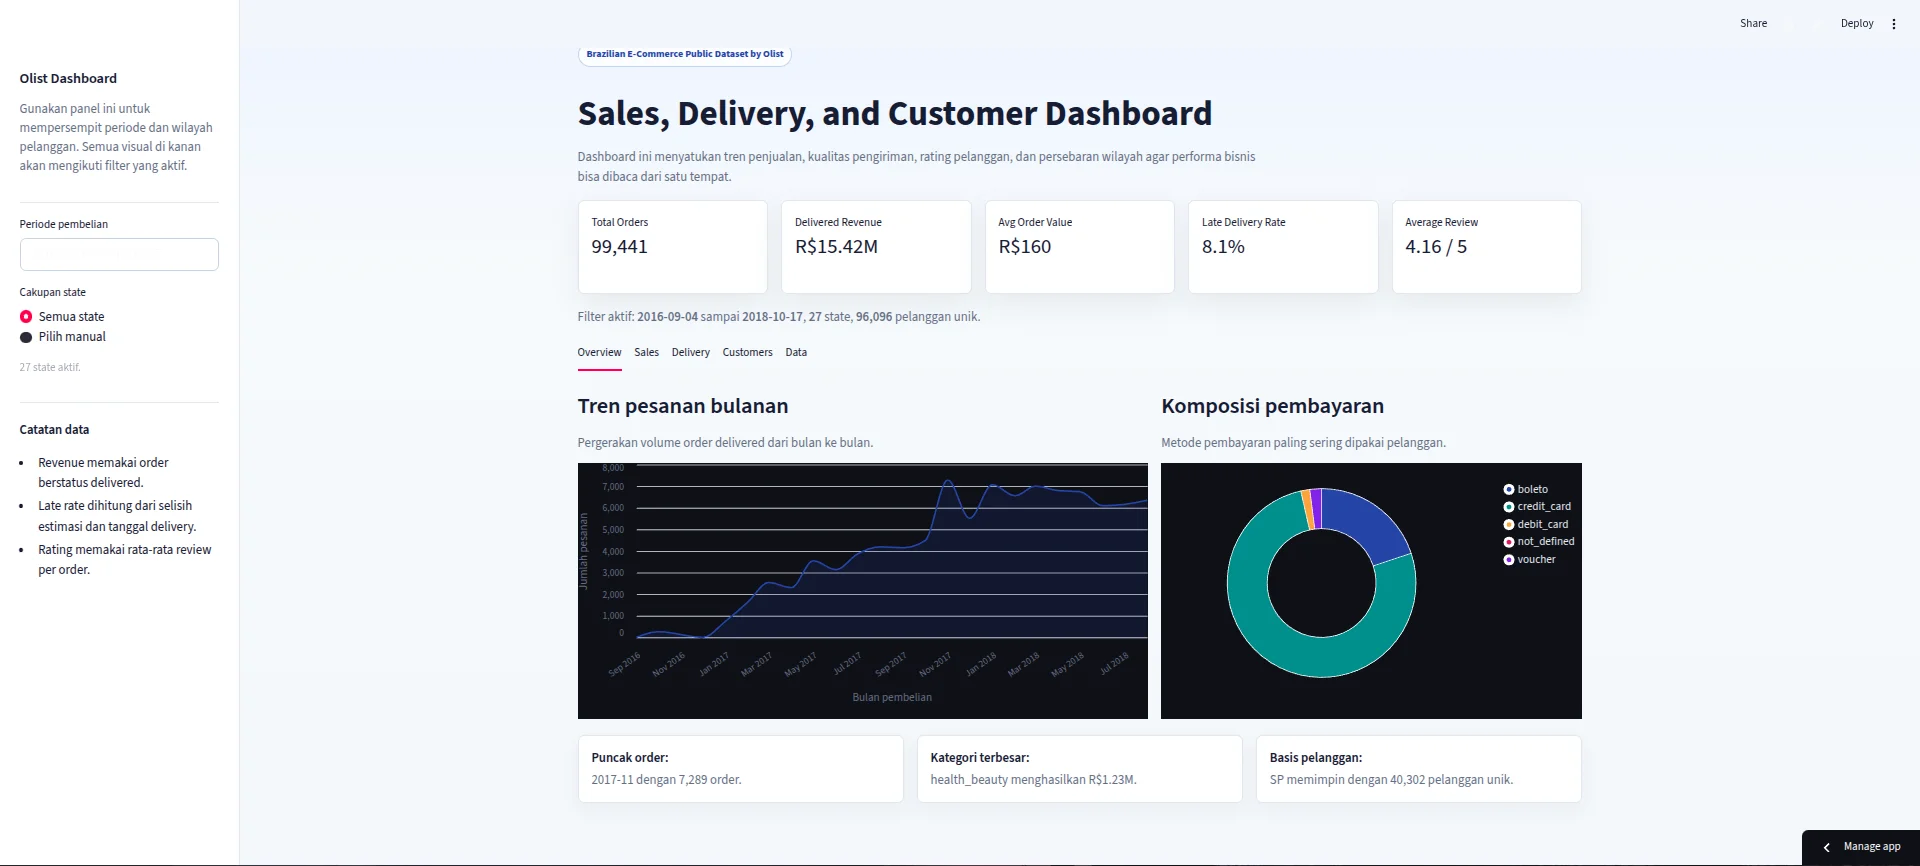
An e-commerce analytics dashboard that combines order, customer, product, and delivery data to monitor sales performance, customer distribution, product trends, and logistics bottlenecks.
My Role
- 01Cleaned and combined Olist marketplace tables into an analysis-ready dataset.
- 02Planned the dashboard KPIs around revenue, delivery delay, customer distribution, and review impact.
- 03Implemented the Streamlit dashboard, filters, visualizations, and summary tables.
Features
- 01Builds an analysis-ready dataset by combining multiple Olist tables into a single main data source.
- 02Interactive date-range and state filters let users narrow the analysis to specific periods and regional segments.
- 03Monthly order and revenue trend charts highlight demand shifts and peak sales periods.
- 04Top product category revenue breakdown shows which categories contribute most to marketplace revenue.
- 05Late-delivery analysis ranks states by delay rate with a minimum-order threshold.
- 06Delivery-status review comparison shows how late shipments correlate with weaker customer ratings.
- 07Customer distribution analysis surfaces states with the largest concentration of unique customers.
Impact
- Transforms raw transactional marketplace data into business-facing KPIs.
- Makes the relationship between logistics performance and customer satisfaction visible.
- Helps identify dominant product categories and high-concentration customer regions.
Stack
StreamlitPandasNumPySeabornMatplotlib